Build Stocks Tracker Web App using Anvil and Google Colab


In this article, I will show you how to build a web app using Anvil and Google Colab to track your favorite stocks. For those who are not aware of Anvil, it is a low-code platform that allows users to build and deploy full-stack web apps using only Python.
User interface of our Anvil app
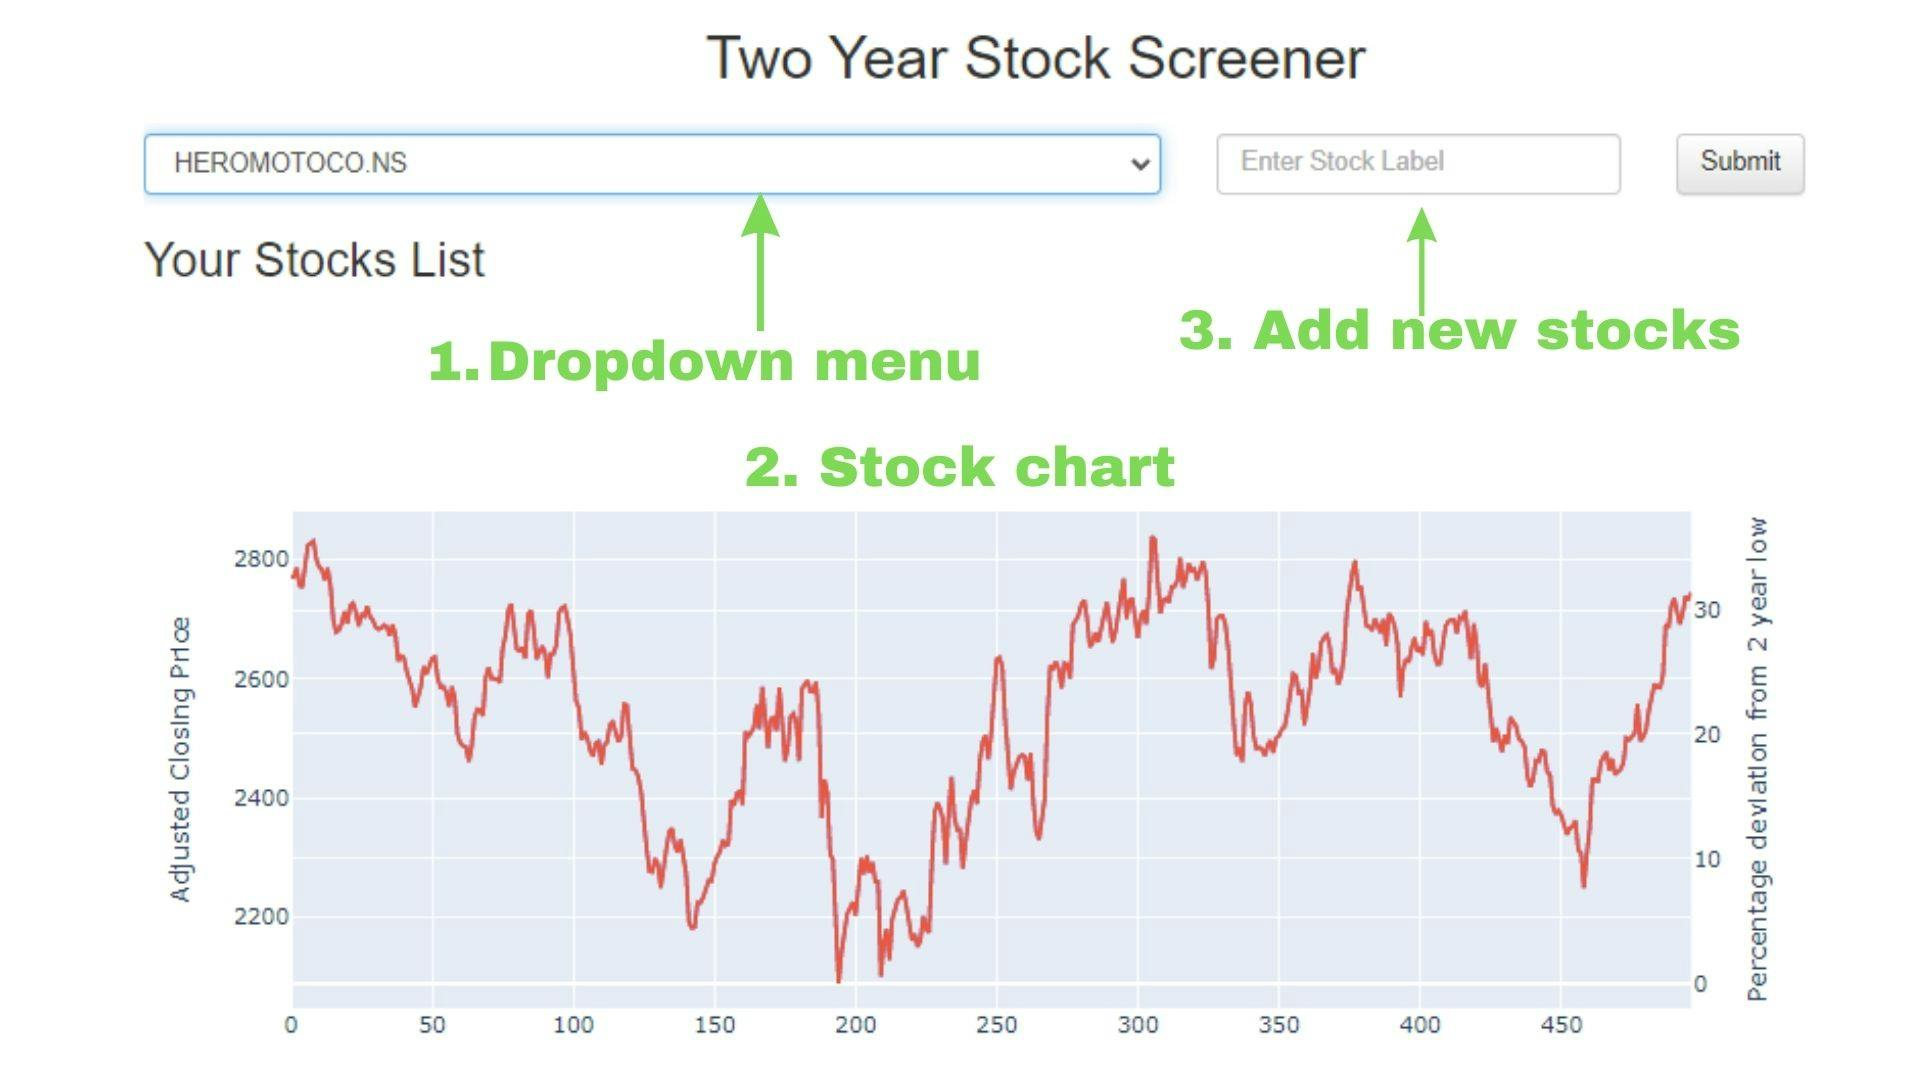
The user interface of our stocks-tracking app has three major components:
Dropdown stock selector - To select the stock to analyze
Interactive stock price chart - A two-year closing price day-level chart
Input textbox - To add new stocks to the app's database
The chart has two vertical axes, the left-side vertical axis represents the adjusted closing price of the stock and the right-side vertical axis represents the deviation of the stock closing price from the two-year low (minimum closing price) in terms of percentage.
Front End code of Anvil app
After creating the UI of the Anvil web app, we can write the front end code. You can even do both UI designing and front end coding in parallel, but I find it more easy to first create a basic UI design and then complete the front end code.
from ._anvil_designer import Form1Template
from anvil import *
import anvil.tables as tables
import anvil.tables.query as q
from anvil.tables import app_tables
import plotly.graph_objects as go
import anvil.server

class Form1(Form1Template):
  def __init__(self, **properties):
    # Set Form properties and Data Bindings.
    self.init_components(**properties)
    # Fetch stock symbols from Anvil app table
    self.ticker_select.items = [row['StockSymbol'] for
                                row in app_tables.stock_list.search()]

  # Function on click of submit button to add new stock
  def submit_button_click(self, **event_args):
    if self.ticker_input.text == None:
      pass
    else:
      # Add ".NS" for NSE stocks
      ticker = self.ticker_input.text.upper() + ".NS"
      # Add stock symbol in Anvil app table
      app_tables.stock_list.add_row(StockSymbol=ticker)

  def ticker_select_change(self, **event_args):
    if self.ticker_select.selected_value == None:
      pass
    else:
      # Call a Python function in Google Colab
      fig = anvil.server.call('two_year_plot', self.ticker_select.selected_value)
      self.plot_1.figure = fig
In the code above, there are two major functions, submit_button_click( ) and ticker_select_change( ) that perform some tasks based on the click of a button or based on the selection of an input value, respectively.
submit_button_click( ) adds a new stock to the Anvil database when the user enters a new stock symbol and clicks the Submit button on the front end of the web app.
ticker_select_change( ) sends the selected stock symbol from the dropdown menu to the Colab notebook and it returns a Plotly chart object. This object is then used to render the chart on the front end of the web app.
Anvil Data Table - The Database
The Data Tables are like internal native databases hosted on Anvil. The free plan provides 50,000 rows and 100 MB of Data Tables which is sufficient for personal projects.
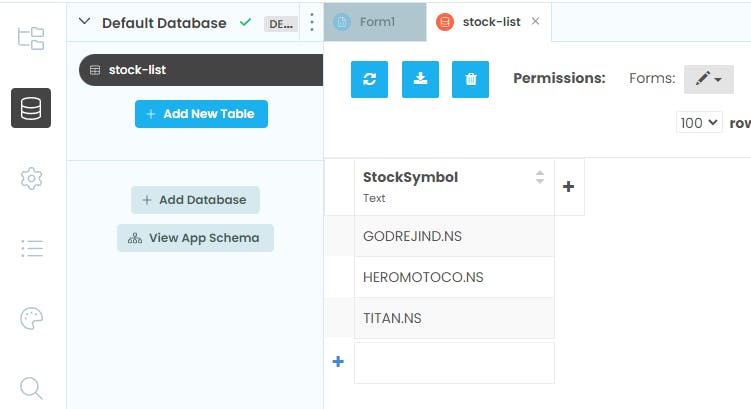
As you can see in the screenshot above, we have created a Data Table called 'stock-list'. It has only one column, 'StockSymbol', that keeps the stocks symbols. New stock labels can be added to the table from the front end. However, the app developer can also manually add, modify and delete records from this table.
Note: Make sure to enable edit permission for this data table.
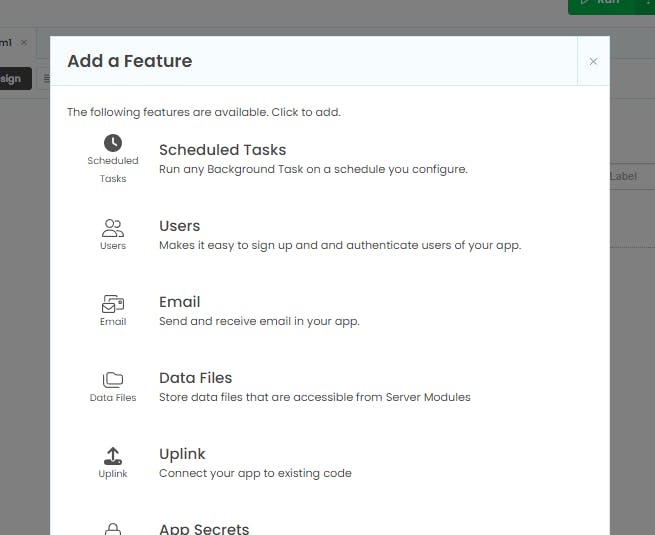
Get Anvil Uplink Key
To be able to use Google Colab with your Anvil app, you would need the Server Uplink key. We will use this key to connect the Anvil web app to our Google Colab notebook which has a function to download stock historical data, create a Plotly chart and return a chart object.
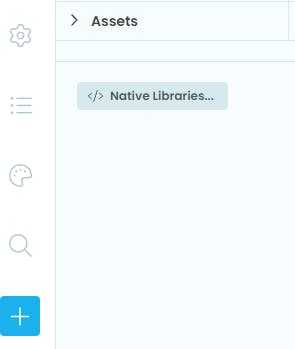
To get the Server Uplink key, click on the "Add" button at the bottom-left corner.
Then from the list of features, select Uplink. There you will find the uplink key that you have to use in Google Colab.
Python code in Google Colab
Once you have retrieved the uplink key, use the code below in a Colab notebook.
First, install the following libraries in Google Colab:
anvil-uplink - To create an uplink from Colab to the Anvil app
yfinance - Yahoo Finance library to download stocks's historical data
!pip install anvil-uplink
!pip install yfinance
This code downloads the historical data of the specified stock for the last two years from the current date. The data is downloaded from Yahoo Finance. Then we are using Plotly Express for data visualization as it is a feature-rich and easy-to-use Python library.
import yfinance as yf
import pandas as pd
import plotly.express as px
import plotly.graph_objects as go
from plotly.subplots import make_subplots
from datetime import date, timedelta
import anvil.server

# Get today's date
today = date.today()

start_date = (today - timedelta(days=731)).strftime("%Y-%m-%d")
end_date = today.strftime("%Y-%m-%d")

anvil.server.connect("--ENTER YOUR ANVIL APP UPLINK KEY--")

@anvil.server.callable
def two_year_plot(ticker = None):
  # Get stock's data
  data = yf.download(ticker, start = start_date, end = end_date)
  # Find two-year lowest price point
  two_year_low = data['Adj Close'].min()
  # Percentage deviation of current price from the two-year minimum price
  data['distance_from_low'] = [round((i-two_year_low)*100/two_year_low, 2) for i in data['Adj Close']]

  # Create Plotly chart
  fig = make_subplots(specs=[[{"secondary_y": True}]])

  fig.add_trace(go.Scatter(y = data['Adj Close']), )
  fig.add_trace(go.Scatter(y = data['distance_from_low']), secondary_y = True)
  fig.update_layout(yaxis=dict(title='Adjusted Closing Price'),
                    yaxis2=dict(title="Percentage deviation from 2 year low"),
                    showlegend=False)

  return fig

# Enable Anvil uplink
anvil.server.wait_forever()
Do check and test your code in the notebook and if everything is working fine then run anvil.server.wait_forever() command to enable the uplink.
Run Anvil Web App with Google Colab Uplink
To run your Anvil app, click on the Run button at the top-right corner.
If you close the Colab notebook, the web app will also crash. The app would run as long as the uplink server (Colab) is running.
You can use any other virtual server as well instead of Google Colab, such as AWS EC2, Azure Virtual Machines etc. Feel free to reach out to me if you have any questions or need any help with Anvil or Python.